Hydraulics reports is a web reporting feature that allows end users to pull utilization data off a wide variety of FORCE LOGIC tools.
While this feature has existed for some time now, we’ve recently updated our hydraulics reporting suite to provide a more modern experience that is more streamlined.
In this article, we'll show you how you can leverage the data generated across your hydraulics inventory into customizable reports that can be shared out with team members, customers, and other important stakeholders.
Let’s show you how to use it.
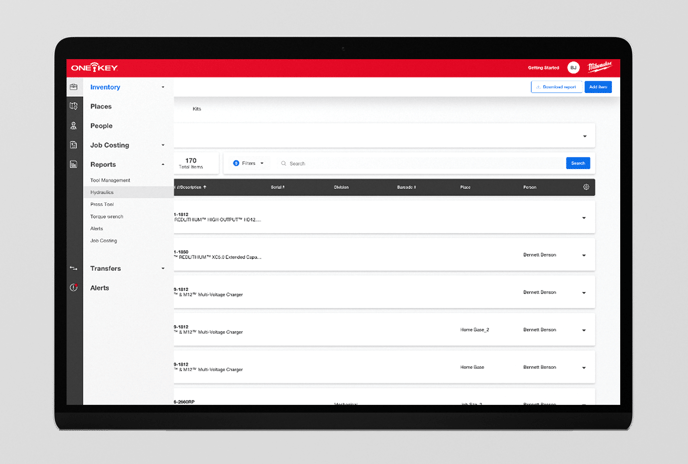
- When you open the One-Key web app in your browser, your inventory will load by default; along the lefthand side of your screen, you’ll select Hydraulics among the Reports submenu.
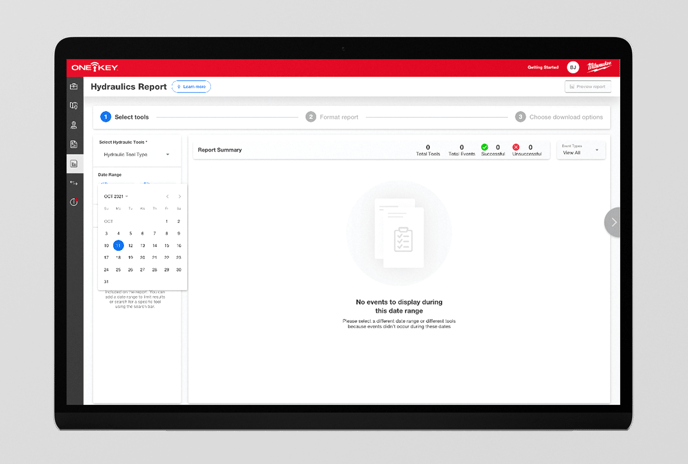
- The Hydraulics Report builder will open. First, you’ll select the type of tool for which you want to build a report.
- Unlike in the past, where any and all data on your tool was pulled, you can now also set a date range, giving you more control over the precise period you want to build your report from.
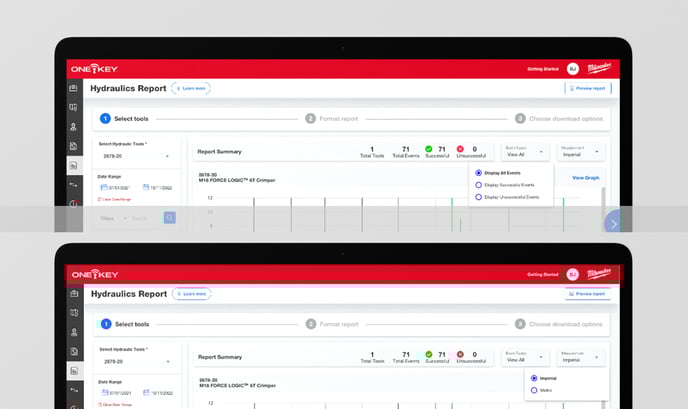
- Once you’ve selected your tool and date range, One-Key will pull all data within these parameters, including all events performed and successful and unsuccessful events (if any exist); you can elect to display successful, unsuccessful, or all events based on the nature of the report you’re building, and also whether you want your report to display imperial or metric measurements depending on where you’re located.
- Select “View graph” to display a graphical representation of your data at the top of your report. We’ve upgraded how we display hydraulic events with an emphasis on utilization and performance. Each bar on the graph represents a timeframe, such as a day or hour a hydraulic event took place. Green bars indicate successful events, while red bars represent unsuccessful events. If you’re looking for a specific pressure associated with an event, this information can still be found in the line item of each event.
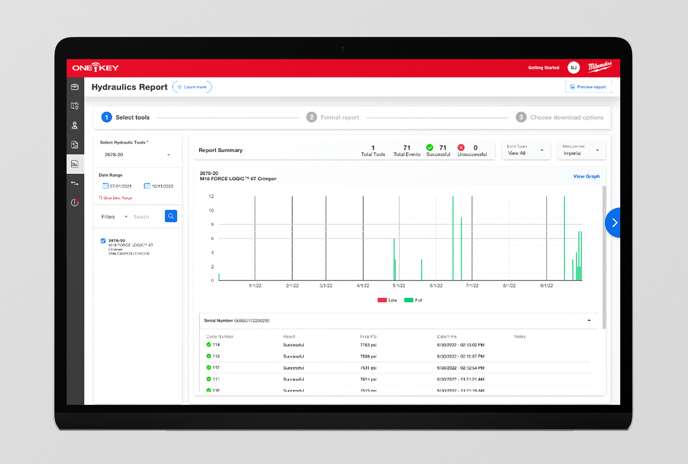
- Below the graph, it will also display individual line items by cycle number, result, final PSI (in imperial) or bar (in metric).
- You can hover over each event on the graph to get more information.
- If your data yield looks good, select Format report to finalize the report you want to send out. In the report formatter, you can:
-
- Change the name of your report to something more specific.
- Toggle on “My company information” to format the report with your company’s logo and contact information. One-Key will pull this information from your admin panel for your convenience, but you can also click Edit to update anything you’d like.
-
- Toggle “My customer information” on if you’re building this report for a customer.
- Toggle on “Include notes” to add any liner notes you’d like to describe the contents of this report for its recipient.
-
- You can also select which events you’d like to show up in this report (whether you want to only display unsuccessful events to address a problem, all successful events to provide QA documentation, or all events within this date range.
- Finally, you can toggle on Include signature to add a line for your recipient to signoff on this report.
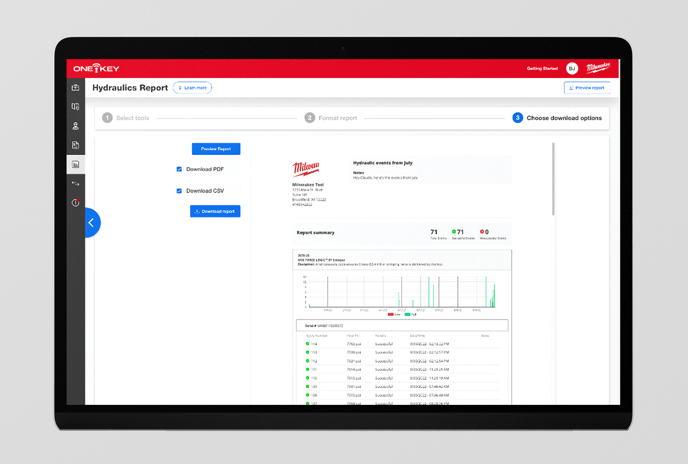
- When you’re done formatting your report, you’ll click Choose download options where you can choose to download this report to your computer as a PDF, a CSV, or both, which can be printed off or attached to an email.
- You can also click “Preview Report” to get an at-a-glance look at your report, making sure everything looks correct before saving.
Hydraulics reports allow end users to leverage a customizable tool utilization reporting suite for free whenever they need to – whether you want to provide proof of work to inspectors and customers or inspect a possible issue with your tool team.